Presentation given for the Center for Nonprofit Success focused on program evaluation basics.

|
Scooped by Beth Kanter |

No comment yet.
Sign up to comment
Get Started for FREE
Sign up with Facebook Sign up with X
I don't have a Facebook or a X account


 Your new post is loading...
 Your new post is loading...
Your new post is loading...
Presentation given for the Center for Nonprofit Success focused on program evaluation basics.
No comment yet.
Sign up to comment

Are you tracking all of your social data with Google Analytics? This article shows how to create custom URLs to find what is called dark social media referral traffic.

donhornsby's curator insight,
September 23, 2014 9:50 AM
With all of the advances in website reporting, many of us are still behind the curve when it comes to attributing the return on social media efforts. Sometimes it’s very difficult toconnect the dots and see where social media is making an impact for your brand. By leveraging Google’s nifty URL builder tool, marketers can track in detail the performance of content posted to social media. Although this approach is fairly basic, it gives you a clearer view of the value of your social media efforts.

Hashtags allow marketers to engage with users they otherwise wouldn’t be able to reach, build branded campaigns, and sleekly measure the results. You can use hashtags in a variety of ways. We’ve broken down the five key ways here, but for more insight into hashtags on Twitter, download our newest ebook The Complete Guide to…

Learn the importance of finding the right social media metrics to track for your marketing. Learn how to get the most value from social engagement.
Beth Kanter's insight:
This e-book is a free download from Simply Measured, part of their content strategy to promote their measurement tools. Nonetheless, it does contain some useful information about the metrics required to measure and fully understand the photo and video-sharing network - and how it use that information to guide your strategy. Gives you the run down on engagement metrics, reach, and optimization, followed by some strategy advice.
Beth Kanter's insight:
Objectives. Little is known about the use of social media as a tool for health communication. We used a mixed-methods design to examine communication about childhood obesity on Twitter. Methods. NodeXL was used to collect tweets sent in June 2013 containing the hashtag #childhoodobesity. Tweets were coded for content; tweeters were classified by sector and health focus. Data were also collected on the network of follower connections among the tweeters. We used descriptive statistics and exponential random graph modeling to examine tweet content, characteristics of tweeters, and the composition and structure of the network of connections facilitating communication among tweeters. Results. We collected 1110 tweets originating from 576 unique Twitter users. More individuals (65.6%) than organizations (32.9%) tweeted. More tweets focused on individual behavior than environment or policy. Few government and educational tweeters were in the network, but they were more likely than private individuals to be followed by others. Conclusions. There is an opportunity to better disseminate evidence-based information to a broad audience through Twitter by increasing the presence of credible sources in the #childhoodobesity conversation and focusing the content of tweets on scientific evidence.

Are you looking for new ways to measure success on Twitter? Get access to Twitter Analytics and find the data you need to track your campaign success.
Beth Kanter's insight:
Do you use Twitter’s built-in analytics tool? Are you looking for new ways to measure success on Twitter? Twitter’s Analytics tool is the social network’s best-kept secret and gives you access to data that other third-party services can’t. In this article I’ll show you how to get access to Twitter Analytics and find the data you need to track your campaign success.
donhornsby's curator insight,
August 5, 2014 8:00 AM
Like Facebook and LinkedIn, Twitter’s analytics feature is designed to be used by the company’s potential paying customers. In other words, only accounts with Advertiser status can access Twitter analytics data.

The inspiration for your next visual content project is probably hiding right under your nose. Here are six easy ways to find your next standout piece.
Beth Kanter's insight:
Good tips on where to find the data for your infographic.

Health Data Exploration Project sees research gold in mining consumer health data from pedometers, fitness bands, and other gadgets.

So the lesson is simple: Data visualization needs to be shaped by the intended users, perhaps more so than the data. Knowing the key user groups who will be working with your creations is essential to making them successful. Trying to visualize without user profiles is like trying to ice skate with blinders on – success will be purely accidental. So take the time to identify and understand all of the key audiences for a data graphic. Treat them with respect and the result will seem like magic.A director of data visualization offers her strategies for shaping and presenting research information.
Beth Kanter's insight:
So the lesson is simple: Data visualization needs to be shaped by the intended users, perhaps more so than the data. Knowing the key user groups who will be working with your creations is essential to making them successful. Trying to visualize without user profiles is like trying to ice skate with blinders on – success will be purely accidental. So take the time to identify and understand all of the key audiences for a data graphic. Treat them with respect and the result will seem like magic.

Real-time intelligence and insights for hashtag campaigns and events.
Beth Kanter's insight:
hashtag tracking
|

Developing a social media strategy is important. But beyond just implementing a plan, you’ll want to evaluate your social channel’s success in order to improve moving forward. Google Analytics is a valuable tool that can help you to analyze and enhance your social media strategy.

Is your content taking you on a journey to nowhere? This guide will help you measure the effectiveness of content across all channels.

A commitment to impact evaluation is the mark of a nonprofit organization that takes its work seriously.
Beth Kanter's insight:
When nonprofits do attempt to measure performance, they tend to become preoccupied with metrics that demonstrate how busy their staff members are (the number of activities conducted, the number of people reached, and so on), and they give short shrift to more relevant metrics that indicate whether their programs are actually improving people’s lives.

Norman Reiss's curator insight,
September 19, 2014 12:58 PM
Does your nonprofit measure its results?

is a research project designed to help identify and understand the laws regulate the collection, use, and storage of data. The conversation around relationship between people, institutions, and data...
Beth Kanter's insight:
is a research project designed to help identify and understand the laws regulate the collection, use, and storage of data. The conversation around relationship between people, institutions, and data is confounded by how broad and complex it is. But as institutions increasingly base their decisions on data, whether big or small, the rules around its collection and treatment become more vital for us all to understand. The Capture the Ocean Project will convene the world’s leading legal, privacy, and data policy experts to create a framework for identifying and comparing the laws that shape the information economy. We will publish these laws in easy-to-understand visualizations and maps, helping people understand the issues, services, and rules that are shaping the world around them. This tool will help governments looking to trends in global policy, entrepreneurs launching web-based services, international development non-profits introducing technology into programs, journalists reporting on new technologies and privacy, and anyone with an interest in investing in the information economy

We're testing dozens of digital apps and tools for social change. Here we share and track our results. Check out our findings and add your own.
Beth Kanter's insight:
Measurement tool box
We live in a world of big (and little) data, and many people have to make sense of numbers as part of their job. The trouble is that there can be a lot of friction involved when mining the data.

Many of us have a set of Key Performance Indicators (KPIs) to measure how we’re doing at our jobs. Number of calls made, meetings booked, contracts signed, tweets, retweets, replies, page views,
Beth Kanter's insight:
We talk and think about questions so much, sometimes I feel like we have entire discussions where we only ask questions. Good questions don’t just beget good answers but also good questions in turn. Questions should make you think. Questions can guide how you decide on the course of your company or product. Questions can help guide better performance.
Beth Kanter's insight:
This nifty tool sends you a text message with your analytics report #datanerd dream app
![How To Track Your Social Media Data And Measure ROI [INFOGRAPHIC] - AllTwitter | Measuring the Networked Nonprofit | Scoop.it](https://img.scoop.it/H74_gcChYOKOpgX5TBWMuDl72eJkfbmt4t8yenImKBVvK0kTmF0xjctABnaLJIm9)
You’ve setup your brand’s Twitter account, launched your business page on Facebook and fashioned a company profile on LinkedIn. You’re uploading content, sharing links to your products and services and engaging with fans. Now, if only you could figure out your return on investment Via Mau

Sybille Pierru's curator insight,
June 28, 2014 1:29 PM
Vous êtes présents sur les réseaux sociaux ? Cette infographie vous guide pour mesurer l'efficacité de votre stratégie et votre ROI. 
Ken Dickens's curator insight,
June 30, 2014 4:27 PM
Nice info graphic about tracking impact of Social Media. -Ken 
Neil Ferree's curator insight,
July 4, 2014 2:22 PM
Some of these social media monitoring methods are more obvious than others. Depending which social network your target audience is most active on, will probably determine where you should spend your time to track your social media ROI. The next step is to come up with a game plan and define your strategy on how to manage your social media presence. If you'd like to discuss your social content marketing campaigns you can click here to schedule a 30 minute Hangout with Neil Ferree

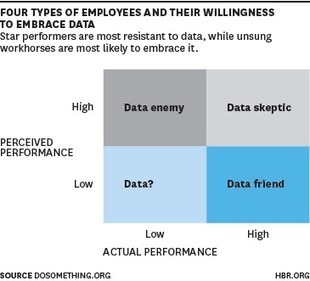
In business, we spend a lot of time trying to understand social data and other forms of big data for strategic advantage: to make business decisions, increase revenue, reduce costs, improve relatio...
Beth Kanter's insight:
Data-informed decision making, and the culture change inherent therein, doesn’t happen in a vacuum. Asking what do the data say before acting is a disruptive action, displacing prior norms. There will be employees like the low-highs who welcome this kind of change, and those like the high-lows who subvert it. Understanding the psychology underlying these behaviors is the necessary first step toward pushing past intuition and silencing the data skeptics.
Beth Kanter's insight:
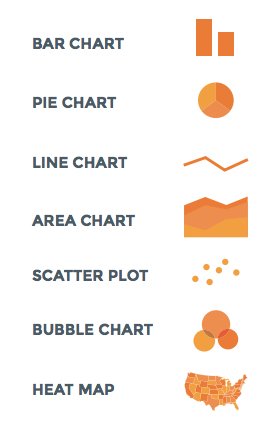
Really useful guide to selecting and designing charts and graphs to visualize your data.
|